A liar’s guide to statistics
Olimpia Onelli explores the ways in which statistics can be used to deliberately manipulate or mislead us

Let’s face it: we are more likely to believe information if it’s coupled with a numerical value or a percentage point. Statistics are used increasingly in advertisements (“kills 99% of bacteria!”), political debates (“Donald Trump has a 16% chance of becoming president!”), and in the news (“new drug lowers incidence of malady by 50%!”) to provide ‘evidence’ for claims and thus increase our trust.
However, we must be cautious. These statistics are often deliberately manipulated in an attempt to influence our perceptions and our behaviour, sometimes to the benefit of some corporation, organisation, or candidate.
The sample upon which a statistical study is based has a significant influence on the outcome: often the sample size is far too small or chosen in an unrepresentative manner, leading to skewed results which do not reflect the views or behaviours of a population at large. One of the most famous cases of such statistical inaccuracy in US history was seen in the 1936 election: Literary Digest contacted 2.4 million voters, randomly chosen from the telephone directory, and based their prediction of an Alf Landon presidency on the responses received. Despite the large size of the sample, in the earlier twentieth century telephones were available only to the rich, and thus the sample was heavily biased towards the wealthier segment of the population who, as it turns out, were far more likely to vote for Alf Landon than Franklin D. Roosevelt – the man who did in fact win the election.
It is said that a statistician can have their head in the oven and their feet in the freezer and say that on average they feel fine. This simple joke illustrates the fact that averages are not always a meaningful way of summarising a statistical distribution, an effect which is particularly obvious for non-uniform distributions. Often a more useful parameter to report is the median, which is the value that cuts a population in two so that there’s a 50% chance of falling below or above it. Medians are used often to compare income: while you’re probably poorer than the average person, you are more likely to have an income closer to the world’s median because a few extraordinarily wealthy individuals (shout-out to Zuckerberg, for example) dramatically skew the distribution.

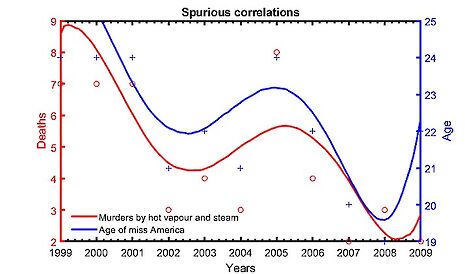
Spurious correlations are another common culprit, as is warned by the common adage: correlation doesn’t imply causation. Graphs alone, though useful tools for representing data, are unable to provide context or prove potential links. While on first view, the diagram, pictured below, appears to suggest an apparent correlation between murders by hot vapour and steam and the age of Miss America, there is no scientific research (as yet!) that could possibly link these things.
Essentially, statistics can be used to convey anything we wish – accurate, representative, ethical, or otherwise. Though they are a great tool for journalists, scientists, and politicians alike, we must be careful to consider the reasoning behind uses of statistics as ‘evidence’ and seek detailed information on methods used to gather data before coming to our own conclusions regarding its validity.
 News / SU reluctantly registers controversial women’s soc18 December 2025
 News / CUP announces funding scheme for under-represented academics19 December 2025
 Features / Should I stay or should I go? Cambridge students and alumni reflect on how their memories stay with them15 December 2025
 Fashion / The art of the formal outfit 18 December 2025
 News / Dons warn PM about Vet School closure16 December 2025


