
New statistics show the complexity of Cambridge access efforts
Analysis: David Lammy’s research has highlighted some striking figures about Cambridge’s intake, but solutions are harder to find
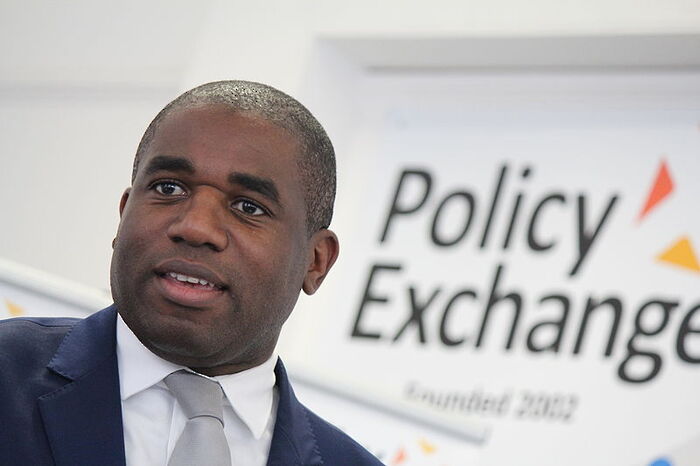
Admissions data from 2010-2015 released by Labour MP David Lammy, showing that the proportion of offers made to applicants from the top two social classes rose from 79% to 81%, has stimulated widespread debate over Oxbridge admissions processes and the effectiveness of current outreach programmes. Since publishing his initial findings, Lammy has also written to the vice-chancellors of both the University of Oxford and the University of Cambridge in a letter signed by more than 108 MPs, calling for reform of the “highly subjective” admissions process.
There were three headline statistics from Lammy’s findings:
- The proportion of Cambridge offers to applicants from the top two social classes (based on NSSEC classifications – covering managerial and professional occupations) rose from 79% in 2010 to 81% in 2015.
- Cambridge made more offers to applicants from four of the home counties than the whole of the North of England.
- During the period 2010-2015, on average a quarter of Cambridge colleges made no offers to black British applicants.
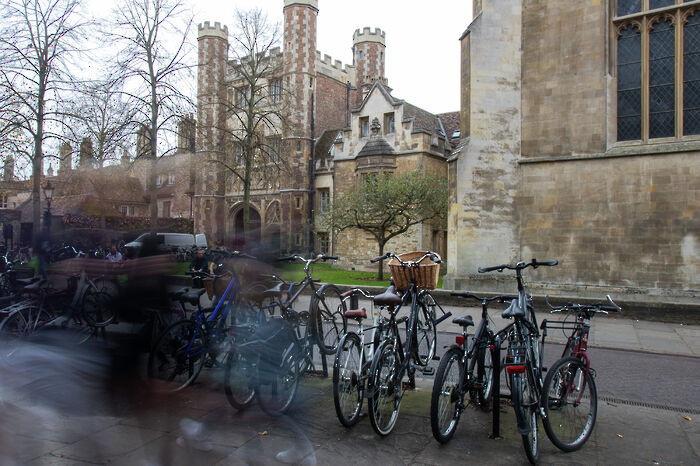
In their letter, MPs criticised the “troubling picture” painted by the statistics, suggesting that college-led admissions processes have created a “patchwork situation, with some colleges working hard to widen access and others lagging far behind”. The statistics released by Lammy reveal notable admissions discrepancies between colleges. Trinity College gave the most offers (49%) to students from independent schools between 2010-2015, with only 30% of offers going to students from state comprehensives. At the opposite end of the scale, King’s made 47% of its offers to students from comps.
In response to this data, Trinity College Student Union (TCSU) Access Officer Seb Millar said, “Trinity may have a more acute problem with access than Cambridge as a whole.” He said that while Trinity had extensive access programmes in place, it was difficult to achieve broad coverage and convey the message to the general state-school population. TCSU President, Toby Henley-Smith added that “Trinity is a community that welcomes students from all backgrounds” and said, “I would not want anyone to be put off applying to Trinity for fear of ‘entrenched privilege’ and I worry that Mr Lammy’s comments may do more harm than good.”
MPs have called upon the universities to make greater efforts to find the most talented students and “set out exactly what steps you will be taking to address the situation”. In an article for The Guardian, Lammy accused colleges of permitting admissions processes which are “dependent on highly subjective interviews and the whims of academics recruiting in their own image”. Speaking to Varsity in this week’s issue, he proposed solutions such as introducing a centralised admissions system, lower grade requirements for students from disadvantaged backgrounds, and greater individual engagement with students from non-traditional backgrounds who have achieved the required grades.
Writing in response to the letter, new Vice-Chancellor Stephen Toope said: “We recognise that more hard work is required, but a great deal has already changed in our outreach work.” He drew attention to the fact that the University’s latest admissions statistics show the highest proportion of state-educated students in 35 years and said that there had also been a “significant increase” in the proportion of UK students from the “hardest to reach communities”.
The statistics which have made the headlines conceal a multitude of complex factors which influence the demographic makeup of students who go on to gain Oxbridge offers. One way of conceptualising this is in terms of the ‘admissions funnel’: as students progress, a wide range of factors influence their likelihood of being accepted into Oxbridge.
Socio-economic background
The most dramatic statistic presented by Lammy is that four-fifths of offers were made to students from the top two NSSEC social classes. Around 31% of the UK population are currently categorised as part of these two ‘managerial and professional’ classes.
- What this misses: these statistics do not take into account recent social mobility. Lammy labelled many Oxbridge colleges “fiefdoms of entrenched privilege” and “last bastions of the old school tie”, failing to take into account the possibility that the parents of some of these top social class students may themselves be first generation university graduates. In a tweet, Lammy claimed “Research (inc by Cambridge) shows that disadvantaged students outperform more privileged peers if they are given the chance and a place”, adding that “So a straight A student from a council estate will outperform (according to the data) a straight A student who had private tutoring etc.”.
School type
Another focal point of the debate has centred around discrepancies between state school and independent school acceptance rates. While around 16% of sixth form pupils in the UK attend independent schools, approximately 38% of Cambridge students are privately-educated.
- What this hides: within state schools, there are significant differences between the proportion of students accepted from comprehensives, and those accepted from grammars. In the 2016-17 admissions cycle, students from grammar schools had a success rate of 32.8%, comparable to that of students from independent schools (34.4%). In comparison, students from comprehensives had a success rate of only 21.2%. Furthermore, we also lack correlated data about the socio-economic backgrounds of successful students from state schools.
Prior attainment
When approached by Varsity, a University spokesperson said: “The greatest barrier to participation at selective universities for students from disadvantaged backgrounds is low attainment at school.” Lower attainment by students from disadvantaged backgrounds narrows the pool of candidates with a realistic chance of being offered a place at Cambridge. Statistics from UCAS suggest that in 2016, only 395 black students achieved 16 UCAS points at A-level (representing both A*AA and A*A*B), grades which match the typical Cambridge grade offer for humanities. Analysis by Varsity shows that black applicants are half as like to be accepted.
- What this hides: sustained focus on the application process glosses over earlier conditions which may remove students from the pool of potential candidates.
Application rates
A key issue is that students from under-represented backgrounds are not making as many applications to Cambridge. Lammy noted that in 2011, 103 state-educated students in Sunderland got three A grades or better at A-levels, yet only four received Oxbridge offers.
- What this hides: we do not know how many of these 103 students actually made applications to Oxbridge. Typically, students from disadvantaged backgrounds are less likely to make applications in the first place.
- Finally, the admissions process itself: admissions form only one part of a long-term, multi-stage process. Analysis only of offer rates masks the wider context in which applications are made.
While debate continues to rage over if and how Oxbridge admissions processes should be reformed, consideration of other statistics, and indeed the wider educational landscape can shed additional light on the state of Oxbridge admissions. A holistic view is necessary, to frame the discussion that is likely to follow about changes to the process. In an interview with Varsity last week, the vice-chancellor said that any changes to the admissions process “would have to be matched with very detailed processes to make sure that the people could succeed when here”
 Comment / Top of the slops: the competitiveness of college dining4 June 2026
 Interviews / What’s the story behind Pages coffee house?8 June 2026
 News / News in Brief: Cambridge crowns, council confirmations, and competitive cricket8 June 2026
 Comment / The Cambridge drift1 June 2026
 News / Cambridge researchers produce ‘world-first’ AI vaccine6 June 2026
 Arts / Don’t rush me – I’m reading!9 June 2026
 Lifestyle / Don’t Cry at Me, Argentina – a next-year abroad story8 June 2026
- News / News in Brief: Cambridge crowns, council confirmations, and competitive cricket8 June 2026
 Science / Failure is the foundation of science8 June 2026
 Fashion / The hidden gems of formal fashion8 June 2026