New undergraduate statistics reveal slow changes to Cambridge demography
Last October saw a record high for ethnic minority freshers, but Cambridge still took in a disproportionate numbers of students from independent sector and South-Eastern UK
by  &
&
This article is 10 years old
Newly-released admissions statistics for October 2015’s undergraduate student intake carry with them a host of revelations about the demographic makeup of last year’s freshers.
Cambridge has once again bucked national averages in a number of metrics, including representation of women and independent school-educated students.
The statistics also reveal a continued geographic dominance for the South-East among Cambridge students, and allow a profile of the ‘average’ 2015 fresher to be created.
Record number of ethnic minority students in latest intake
A record number of ethnic minority undergraduates joined the University of Cambridge last October, the statistics show.
20 per cent of 2015’s Home undergraduate matriculants identified as being members of an ethnic minority group – a record high, and an increase of 1.1 per from last year. The percentage has risen by 7 per cent since 2006’s.
Cambridge’s intake of ethnic minority students as a proportion was lower than the national average – 79.2 per cent of new entrants were white, compared to 73.6 nationwide.
5.8 per cent of successful Home applicants gave their ethnicity as ‘Indian’, the highest proportion of any ethnic minority. ‘Mixed White and Asian’ and ‘Chinese’ were the next highest, on 3 and 2.7 per cent respectively.
Only one successful applicant gave their ethnicity as ‘Black Other’, making it the least-represented ethnic group. ‘Mixed White and Black African’ and ‘Black Caribbean’ were the next least-represented groups, with 0.4 per cent of Home matriculants each.
5.2 per cent of newly accepted students registered themselves as having a disability, a 0.4 per cent increase on 2014’s intake, but marginally lower than 2013’s figure. The most common disabilities listed were specific learning disabilities, such as dyslexia and dyspraxia.
Overseas students make up 22.7 per cent of the total acceptances, exactly the same proportion as the previous year. The largest group of Overseas students by nationality are Singaporeans.
High-grades and from the South-East: Is there a ‘typical’ fresher?
97.7 per cent of accepted students achieved the equivalent of A*AA or higher in their three best A-levels, an increase of 0.4 per cent on last year.
Of those students who achieved the maximum UCAS tariff score of 420 (3 A* grades), Cambridge gave offers to 65 per cent of male candidates, and 47 per cent of female applicants.
The proportion of student from independent schools remained above the national average – 37.7 per cent of Cambridge freshers educated in British establishments went to independent schools, despite being attended by 18 per cent of students over 16 nationwide.
Cambridge’s Home intake demographics continue to be dominated by the South-Eastern part of the UK, with over four times as many students coming from Greater London than Wales, Scotland and Northern Ireland combined.

Of the Home students accepted, Greater London is the UK region with the highest proportion of successful applicants, at 23 per cent. It is followed by the South East, home to 21.3 per cent of successful applicants.
Northern Ireland had the lowest proportion of Home acceptances, at 1.5 per cent, and is closely followed by Scotland, which had 1.8 per cent.
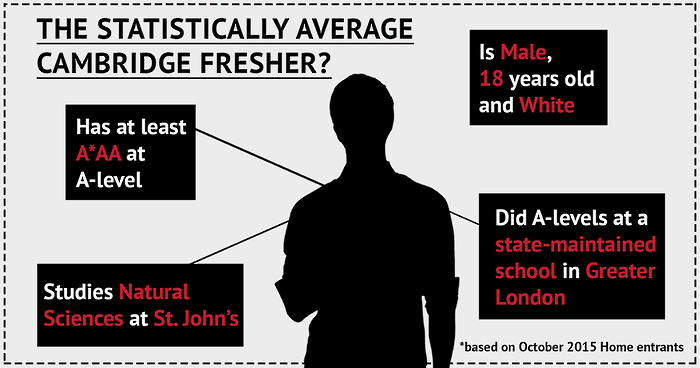
The statistics allow a profile to be created of a ‘typical’, statistically-average 2015 fresher. The available statistics are given in individual tables, which means it is impossible the see the overlap of multiple categories. However, a rudimentary model may be made, based on a combination of mean and modal category averages.
The ‘typical’ 2015 fresher is a white, 18 year old male, who studies Natural Sciences at St John’s. He studied at a state school in Greater London, where he attained at least three A-levels at A*AA.
Cambridge remains atypical in having a larger proportion of men than women in its intake. 2015’s freshers were 52 per cent men, and 48 per cent women – across the UK, this number was 57 per cent women to 43 per cent men.
 Comment / Cambridge outside the table18 May 2026
 Science / Forked over: dish-parity between college cafeterias17 May 2026
 News / New opening date announced for Cambridge South railway station16 May 2026
 News / Protesters disrupt environmental conference at Jesus18 May 2026
 News / News in Brief: bus gates, battery acid, and birthdays17 May 2026
 Arts / The rise and fall of the Lit-girl 19 May 2026
 News / Emma ranked worst college for climate action19 May 2026
 Lifestyle / What breed of chaotic are you going to be this Easter?18 May 2026
- Comment / Cambridge outside the table18 May 2026
 Sport / Oxford overpower spirited Cambridge comeback to win Varsity cricket18 May 2026