


EXCLUSIVE: Trinity tops Tompkins Table for seventh straight year
Christ’s and John’s close the gap at the top, while Lucy Cavendish set new record for mature colleges
by  &
&
This article is 7 years old
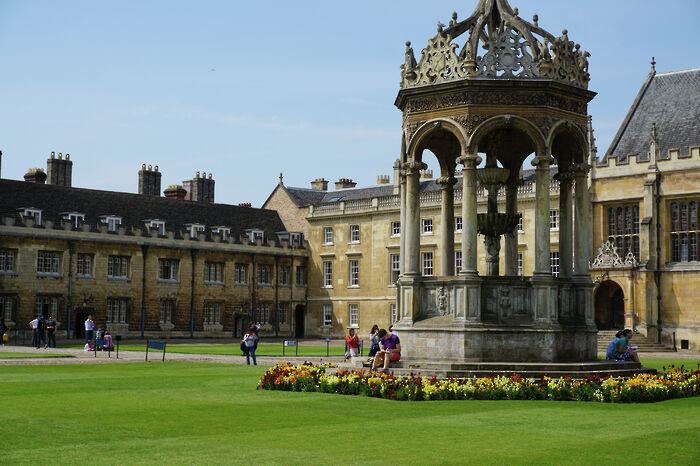
Trinity College has topped the Tompkins Table for 2017, recording its seventh consecutive first place finish in the annual ranking of college academic performance.
Lower down in the table, Lucy Cavendish has put in the best-ever result for a mature college, rising eight places.
With a score of 74.2%, Trinity remains well clear of its nearest rivals, Christ’s and St John’s, which both scored 71.7%, but the lead is less than half what it was last year.
Click here to skip to this year’s table
As usual, there were big movements in the middle of the table, where small percentage changes can make a big difference to a college’s standing. Pembroke, runners-up in 2016, fell to fourth despite posting a higher score than last year, while Churchill rose six places to fifth. Other big movers in the top ten were King’s and Selwyn, which both also climbed six positions to finish eighth and ninth respectively. Downing was the biggest loser in this year’s table, tumbling eight places to twentieth position.
The Tompkins Table, which has been compiled by Peter Tompkins annually since 1981, classes all BA Tripos results with a score of 5 for a first, 3 for a 2:i, 2 for a 2:ii and 1 for a third. These scores are then calculated as a percentage of the maximum possible score a college could get to produce a ranking. Since 2010, the top spot has been firmly held by Trinity, Cambridge’s wealthiest college.
Trinity recorded the highest percentage of firsts once again this year, with 41.5% of candidates reaching the top classifications. Christ’s and Emmanuel had the next highest percentage of firsts, tied on 35.2%.
It was the second strong result in a row for Christ’s, which dramatically rose to second place last year and is now offering the strongest challenge to Trinity’s dominance.
“Christ’s was a strong winner fifteen years ago,” Peter Tompkins said, “and may present a challenge in future years.”
Christ’s senior tutor, Dr Robert Hunt, told Varsity his college is “proud of our students and the results they have achieved through their hard work,” pinning the secret to success on rigorous interviews policies “meaning that we select the very best of our applicants”.
Further down the table, one of the most striking results came in for Lucy Cavendish, with the women-only mature college rising eight places, and increasing its total percentage of firsts by a staggering 14.5%. The result put Lucy Cav – which has placed bottom for most of the past decade – into 18th, ahead of any other mature or women’s college. It is the best result for one of the four mature colleges which take undergraduates since they entered the table in 2003.
Jackie Ashley, president of Lucy Cavendish, welcomed the result, describing it as “a tribute to the hard work put in by Fellows, Directors of Studies, Tutors and of course, above all, our wonderful students”.
Murray Edwards found itself at the bottom of the table for the first time since mature college results have been tracked.
There have been some doubts over the past year as to whether the Tompkins Table would be published again, after the University Council voted to abolish public class lists, which are the assumed source for the table. That decision was overturned by a vote by fellows and senior members in December. In February, Varsity revealed that the lists may be under threat once again, this time as the result of new EU data laws.
The Tompkins Table 2017: results in full
| Rank | College | Score | (Rank 2016) | Change in Rank | % Firsts | (% Firsts 2016) | Change in % Firsts |
|---|---|---|---|---|---|---|---|
| 1 | Trinity | 74.2 | 1 | 0 | 41.5 | 45.1 | -3.6 |
| 2 | Christ’s | 71.7 | 3 | 1 | 35.2 | 31.6 | 3.6 |
| 3 | St John’s | 71.7 | 5 | 2 | 33.7 | 29.8 | 3.9 |
| 4 | Pembroke | 71.0 | 2 | -2 | 32.9 | 32.7 | 0.2 |
| 5 | Churchill | 70.8 | 11 | 6 | 34.9 | 30.5 | 4.4 |
| 6 | Emmanuel | 70.2 | 4 | -2 | 35.2 | 30.9 | 4.3 |
| 7 | Queens’ | 69.6 | 6 | -1 | 30.3 | 30.1 | 0.2 |
| 8 | King’s | 69.3 | 14 | 6 | 32.4 | 30.3 | 2.1 |
| 9 | Selwyn | 69.1 | 15 | 6 | 28.6 | 28 | 0.6 |
| 10 | Peterhouse | 68.9 | 8 | -2 | 29.9 | 31.8 | -1.9 |
| 11 | Gonville & Caius | 68.8 | 19 | 8 | 28.1 | 26.2 | 1.9 |
| 12 | Corpus Christi | 68.7 | 10 | -2 | 27.9 | 28.9 | -1 |
| 13 | Clare | 68.4 | 18 | 5 | 29.2 | 25.9 | 3.3 |
| 14 | Jesus | 68.4 | 7 | -7 | 28.1 | 29.3 | -1.2 |
| 15 | Trinity Hall | 67.9 | 13 | -2 | 28.1 | 29.2 | -1.1 |
| 16 | Madgalene | 67.8 | 9 | -7 | 29 | 28.4 | 0.6 |
| 17 | Sidney Sussex | 67.6 | 16 | -1 | 28.2 | 25.5 | 2.7 |
| 18 | Lucy Cavendish | 67.5 | 26 | 8 | 28.3 | 13.8 | 14.5 |
| 19 | St Catharine’s | 66.9 | 17 | -2 | 24.9 | 24.6 | 0.3 |
| 20 | Downing | 66.5 | 12 | -8 | 23.4 | 29.2 | -5.8 |
| 21 | Fitzwilliam | 66.1 | 23 | 2 | 25.7 | 23 | 2.7 |
| 22 | St Edmund’s | 65.1 | 28 | 6 | 25.8 | 19.8 | 6 |
| 23 | Newnham | 64.6 | 21 | -2 | 21 | 21.9 | -0.9 |
| 24 | Girton | 64.1 | 27 | 3 | 21 | 19 | 2 |
| 25 | Robinson | 64 | 22 | -3 | 20.6 | 22.2 | -1.6 |
| 26 | Hughes Hall | 63.9 | 29 | 3 | 17.1 | 14.1 | 3 |
| 27 | Wolfson | 63.8 | 20 | -7 | 18.9 | 21.6 | -2.7 |
| 28 | Homerton | 63.7 | 24 | -4 | 21.5 | 20.8 | 0.7 |
| 29 | Murray Edwards | 63 | 25 | -4 | 16.8 | 18.8 | -2 |
 News / Police to stop searching for stolen Fitzwilliam jade17 April 2024
 Interviews / ‘It fills you with a sense of awe’: the year abroad experience17 April 2024
 News / Night Climbers call for Cambridge to cut ties with Israel in new stunt15 April 2024
 Sport / Kabaddi: the ancient sport which has finally arrived in Cambridge17 April 2024
 Features / Cambridge’s first Foundation Year students: where are they now?7 April 2024
 News / Copycat don caught again19 April 2024
 News / Emmanuel College cuts ties with ‘race-realist’ fellow19 April 2024
 News / Hundreds of elite private schools benefitted from ‘widening participation’ measures19 April 2024
 News / Acting vice-chancellor paid £234,000 for nine month stint19 April 2024
 News / Cambridge Christian Fellowship DMs student ‘sinners’19 April 2024